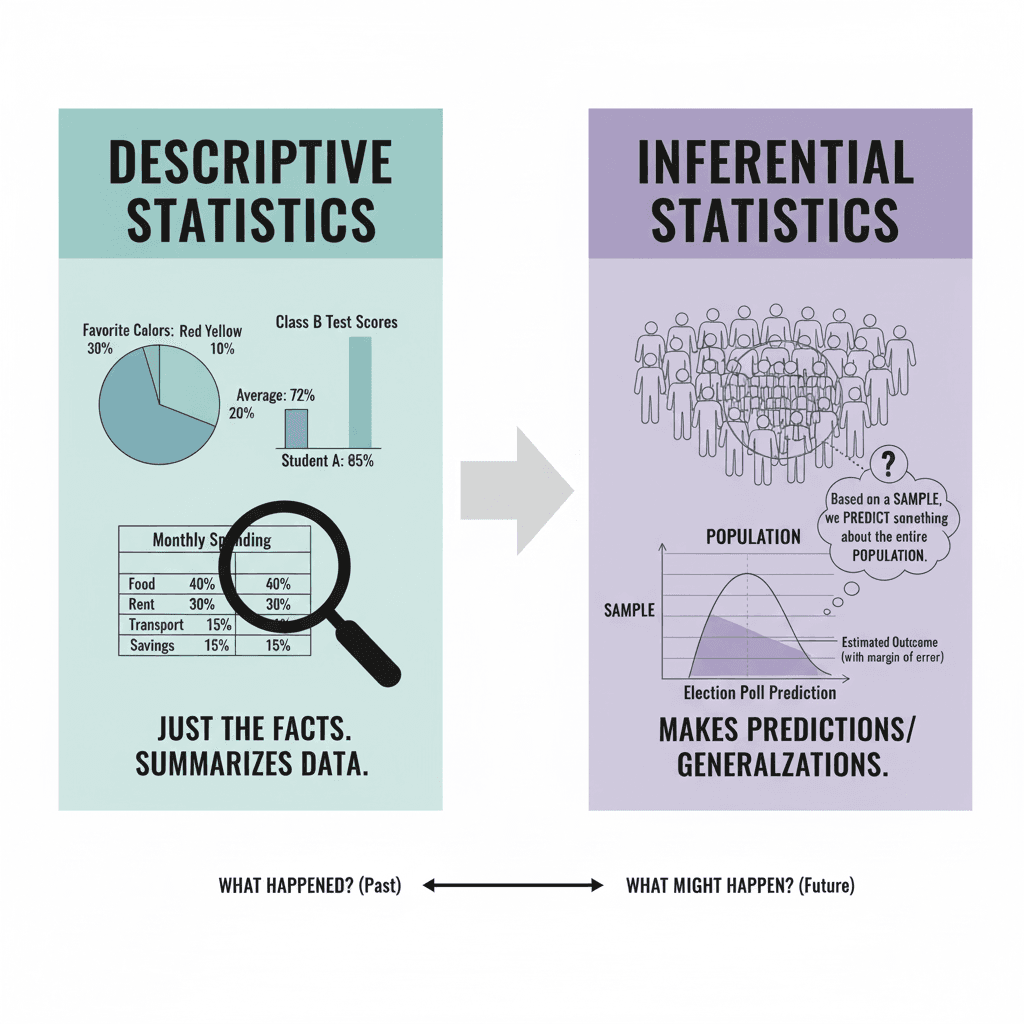
When folks talk about descriptive stats, they’re usually just referring to the basic numbers we throw around to sum up a dataset. It could cover everyone in a population, or just a smaller sample. Either way, it gives you a quick picture of what the data looks like without diving into every detail.
Most people already know the usual suspects — mean, median, and mode. Those are the central tendency measures, basically telling you where the “middle” of the data sits. But that’s only half the story. You also need to know how spread out the numbers are. That’s where things like standard deviation, variance, min, max, skewness, and kurtosis step in. Put together, the two sides show you both the center of your data and how far everything strays from that center.
So, How Do Companies Use Descriptive Analytics?
This isn’t just theory. Businesses actually use descriptive analytics all the time. Think of it as the rear-view mirror: it tells you what’s already happened.
- Finance teams keep an eye on revenue growth or expenses each quarter.
- Marketers watch KPIs like conversion rates, campaign reach, or even how many new followers they’re pulling on social media.
- Manufacturing folks monitor downtime and production throughput to figure out if machines are performing well.
It’s basically the scoreboard for different parts of the business.
Where You’ll See Descriptive Analytics in Action
- Reports Those company financial statements? Yep, descriptive analytics powers most of the numbers in there. And not just finance reports — it shows up in lots of day-to-day reporting too.
- Visualizations A raw table of numbers is hard to digest, right? That’s why charts and graphs exist. They make the numbers easier to explain and share.
- Dashboards These are like command centers for managers and executives. A dashboard pulls in KPIs, puts them into charts or widgets, and lets people track things live. Everyone gets the data that matters most to them, all in one place.
Why Does This Matter for Businesses?
The short answer: it helps people make better calls.
Descriptive analytics shines a light on patterns that would otherwise stay hidden in spreadsheets. Instead of staring at raw data, leaders can instantly see how the company’s doing and where changes might be needed.
It’s also great for communication. For example, if investors or banks want to know how solid a company is, they’ll look at descriptive numbers like sales, profits, debts, and cash flow. In other words, it builds trust because it’s based on hard facts, not guesses.
Steps to Create Your Own Descriptive Analytics
If you’re trying to set up descriptive analytics for your own business, the process usually looks like this:
- Pick the Metrics That Matter Decide what’s worth tracking. A fast-growing company might care most about quarterly revenue, while an accounts team might track how long it takes customers to pay their bills.
- Find the Right Data Figure out where that data lives. Sometimes it’s scattered across files, systems, or even external sources like industry databases or social media. Companies with ERP systems usually have most of it in one place.
- Prepare the Data This step can be messy. You’ve got to clean out errors, merge files, and format everything so it works in your analysis tools. Data modelling helps structure all this so it’s usable.
- Run the Analysis You don’t need fancy software for everything — spreadsheets work for a lot of cases. But BI tools make life easier if you’re tracking bigger, ongoing data. Sales managers might calculate average revenue per deal, while execs track profit margins.
- Showing the Results At the end of the day, you’ve got to present those numbers in a way people can actually digest. Some folks love charts — pie charts, bar graphs, line graphs — because visuals just click faster. Others (especially finance people) prefer straight-up tables full of numbers. There isn’t a single “right” way here; it really depends on who you’re talking to.
Wrapping It Up
Descriptive analytics isn’t about predicting the future or looking into a crystal ball. It’s much simpler than that — it’s about showing what already happened.
Think of it as the storytelling part of data. Instead of leaving numbers scattered everywhere, it pulls them together, organizes them, and paints a clearer picture of the past.
And for businesses, that’s powerful. It means decisions are made on facts, not guesses. It makes communication between teams smoother. And in the bigger picture, it gives the company a stronger base to plan what comes next.


