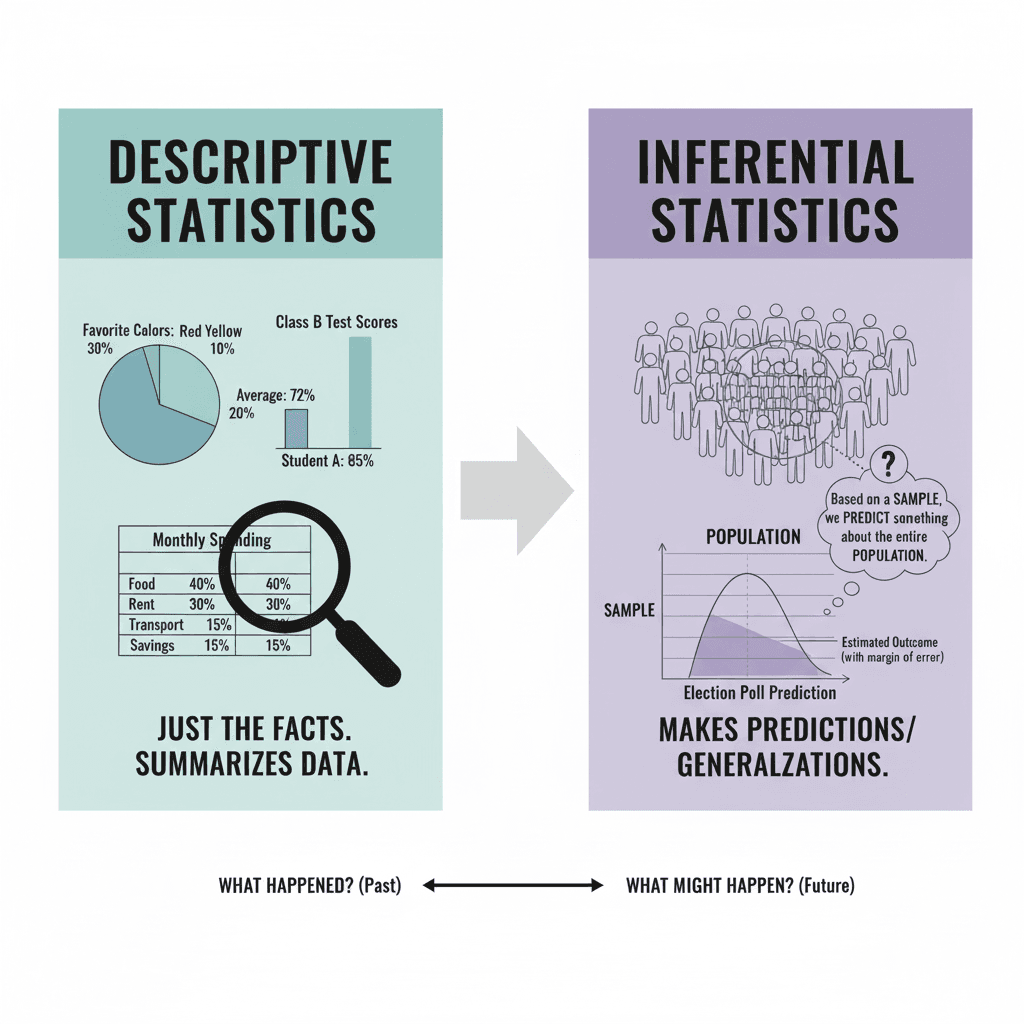
Statistical Analysis: Descriptive vs Inferential
Okay, so let’s talk about statistics. Don’t roll your eyes yet — I know the word alone makes people think of boring math classes, but honestly, it’s not that scary. In business (and real life), statistics is just a way of making sense of numbers. Nothing magical.
Now, here’s the deal: there are two big “flavors” of statistical analysis. Descriptive and Inferential. If you’ve ever wondered what the difference is, let’s keep it simple.
First Things First: What’s Statistical Analysis?
Forget complicated definitions. It’s basically answering the question: “What happened?” by looking at data.
Like when you check your Spotify Wrapped at the end of the year — it shows your most-played artist, hours listened, top songs. That’s descriptive statistics. If Spotify then tried to guess what new artists you might like in 2025 based on a small set of your habits, that’s inferential.
Descriptive Analysis: Just the Facts
Descriptive is like… showing the highlight reel. No predictions, no explanations. Just, “Here’s what the numbers say.”
Examples:
- A teacher says, “Class average was 72%.”
- Your monthly expense tracker says, “You spent 40% on food.”
- A business dashboard shows, “Sales went up 12% this quarter.”
That’s it. Clean, simple, no guesswork.
Inferential Analysis: The Guesswork Side
Inferential is different. Instead of using all the data, you take a sample and try to guess about the whole.
Think about election polls. No one’s asking every single voter — they talk to maybe 2,000 people and then predict how millions will vote. That’s inferential.
Or a company launches a new product. Instead of surveying all 10,000 customers, they ask 200 and say, “Looks like people will like it.”
Of course, it’s not perfect — because samples can be tricky — but it’s faster and often good enough to guide decisions.
So, What’s the Difference?
Easy way to remember:
- Descriptive → “Here’s what happened.”
- Inferential → “Here’s what might be true for the bigger picture.”
If descriptive is like reading the box score after a basketball game, inferential is like predicting how the team will play next week after watching a couple of matches.
Why Use Both?
Businesses usually need both. Descriptive is good for reports and dashboards. But it only looks backward. Inferential adds a forward-looking twist by letting you make generalizations.
Example combo:
- Descriptive: “We sold 5,000 units last month.”
- Inferential: “Based on 300 surveyed customers, sales could rise 15% next month.”
See the balance? One’s the reality check, the other’s the educated guess.
Where You’ll Notice It in Real Life
- Healthcare: Average recovery time from a dataset = descriptive. Predicting how a new medicine might work for the entire population based on a test group = inferential.
- Retail: Sales report = descriptive. Demand forecast = inferential.
- Education: Average test scores = descriptive. Predicting how all students might perform next semester from one class = inferential.
Wrapping It Up
Here’s the takeaway: descriptive is about looking at what’s right in front of you. Inferential is about using a piece of data to say something bigger.
Both matter. Both get used together. And honestly, once you see it this way, statistics doesn’t feel so terrifying.
Next up, I’ll talk about Diagnostic Analysis — the part that digs into why something happened, not just what or how.


