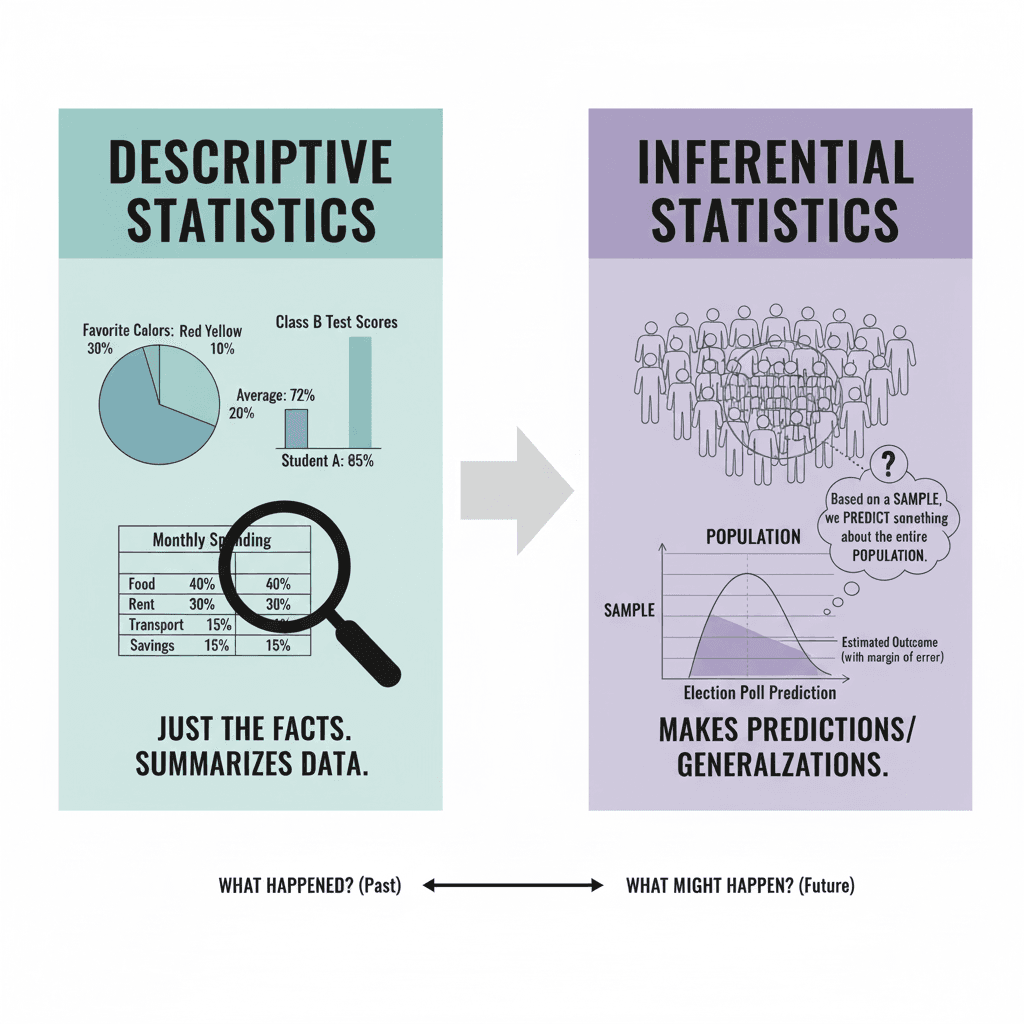
So, you’ve got your data. You’ve done the descriptive part — you know what happened. Maybe sales dropped last month, or maybe your website traffic spiked for no reason. That’s cool, but here’s the thing: just knowing the “what” isn’t enough. Businesses (and honestly, people in general) always want to know — “Why did this happen?”
That’s exactly where diagnostic analytics comes in. It’s like playing detective with your data.
First, a Quick Recap
Descriptive analysis was the “what happened” stage. You’re looking at raw facts: sales figures, exam averages, or whatever. But descriptive doesn’t explain anything.
Diagnostic analysis takes the next step. It says:
- Okay, sales dropped — but was it because customers didn’t like the new pricing?
- Traffic went up — was it from a viral post or a paid ad?
- Your grade slipped — was it because you studied less or because the exam was harder?
It’s about asking the why questions instead of just staring at the numbers.
How Does It Work?
There’s no single formula, but here’s the general vibe:
- Drill Down – Break data into smaller chunks. Example: Sales dropped overall, but when you zoom in, maybe it only dropped in one region or one product line.
- Compare & Contrast – Look at past data, competitors, or other segments. Example: “This ad campaign didn’t work in Europe, but it did fine in Asia. Why?”
- Correlation – Spot patterns. Maybe whenever social media engagement drops, sales dip too. Doesn’t mean one causes the other, but it’s a clue.
- Root Cause Analysis – Keep asking “Why?” until you hit the actual problem. Kinda like when a mechanic keeps poking around your car until they figure out what’s rattling.
A Real-Life Example
Imagine you run a café. You notice revenue dipped in July. Descriptive told you “sales are down 15%.” Diagnostic will ask:
- Did fewer people walk in?
- Were online reviews worse?
- Was the weather bad and fewer folks wanted iced coffee?
- Or maybe a competitor opened across the street?
By connecting the dots, you can say, “Okay, it wasn’t random — here’s what actually caused it.”
Tools People Use for Diagnostic Analytics
You don’t have to be a math genius. A lot of the tools are built into what businesses already use:
- Dashboards (like Power BI, Tableau) that let you filter and drill down
- Root cause analysis methods (like fishbone diagrams, 5 Whys)
- Comparative charts (year-over-year or side-by-side product performance)
It’s less about fancy algorithms and more about asking the right questions and poking at the data until you see the story.
Why It Matters
Think about it: if you only stop at descriptive analytics, you’re basically reading a scoreboard without knowing the game highlights. Sure, you know your team lost 80–72, but why? Did the star player get injured? Did the other team nail all their 3-pointers?
Businesses live and die on the “why.” If sales tanked and you don’t know why, you’ll keep repeating the mistake. But if you know exactly why, you can fix it or avoid it next time.
Everyday Examples (Beyond Business)
- Fitness: You step on the scale and you’re heavier this week (descriptive). Diagnostic would ask: “Did I skip workouts? Did I eat out more? Or was it water retention?”
- School: You got a lower grade on this test. Diagnostic says: “Was the subject harder? Did I study less? Or maybe I misunderstood the format?”
- Workplace: Team productivity dropped. Diagnostic digs in: “Were people on vacation? Was there a tech issue? Or was morale just low?”
Wrapping It Up
Diagnostic analytics is basically data’s version of detective work. You’re not just looking at what happened — you’re digging into why it happened.
It’s not always neat and perfect, and sometimes the answer isn’t obvious. But the more you ask “why,” the closer you get to the truth.


