Data analysis, in simple words, is about cleaning up data, transforming it into a usable form, and then digging into it to pull out information that actually makes sense for decision-making. The main idea is to figure out what the data is really saying so that you can use it to make smarter choices.
Think about daily life—you do data analysis without even realizing it. For example, when you decide whether to buy something or not, you think about your past spending or what might happen if you spend that money now. That’s basically analyzing past and future outcomes before acting. Businesses just do the same thing but with a lot more data and proper tools.
Different Techniques and Methods of Data Analysis
Depending on the purpose and the tools, there are a bunch of ways to do data analysis. The main ones people usually talk about are:
- Text Analysis
- Statistical Analysis
- Diagnostic Analysis
- Predictive Analysis
- Prescriptive Analysis
Text Analysis
This one is also called data mining. It’s basically about finding patterns inside big piles of data. Earlier, people used it mainly to turn raw data into something useful for businesses. Now, with business intelligence tools, it’s easier to dig through data, find trends, and interpret what’s going on. In short—it’s like mining for insights.
Statistical Analysis
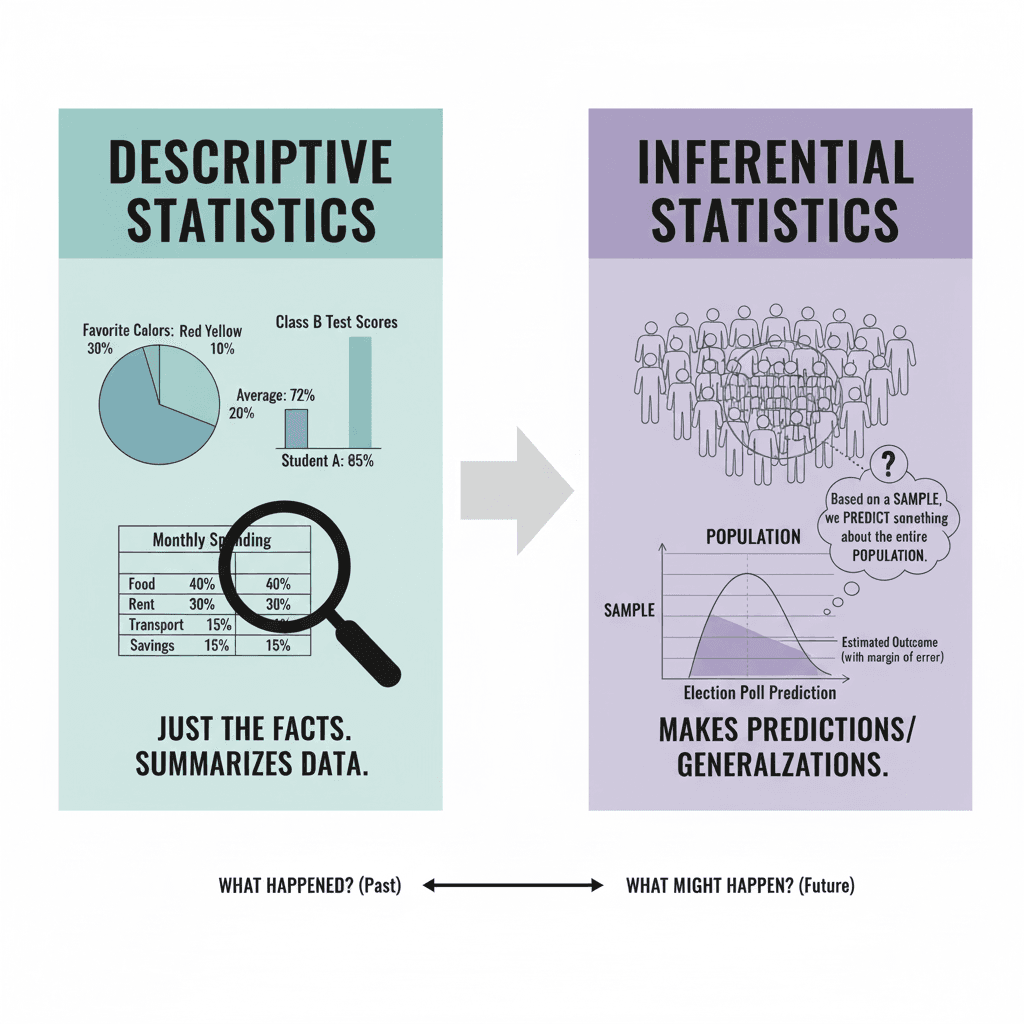
Statistical analysis tells you “What happened?” It uses historical data, usually shown in reports or dashboards. It involves collecting numbers, analyzing them, and then explaining what the data looks like.
It’s split into two types:
- Descriptive Analysis: looks at all the data or a summarized version of it. Shows averages, percentages, frequencies, etc.
- Inferential Analysis: works with just a sample of the data and tries to make conclusions. You can actually get different results from different samples, which is why this is handy for testing ideas.
Diagnostic Analysis
This one tries to answer “Why did that happen?” It digs into the causes behind the numbers you already saw in statistical analysis. Businesses use it to track down problems or trends. If a new issue pops up, you compare it with old patterns to see what’s going wrong.
Predictive Analysis
Here, the focus is on “What might happen next?” You use past data to make guesses about the future. For example, if you bought two dresses last year and your salary doubles this year, you might think you can buy four. But then you realize other things matter too—like higher prices or new priorities (maybe you’d rather buy a bike than more clothes). That’s how predictive analysis works—it’s not perfect, but it gives you a fair idea.
Prescriptive Analysis
This one goes a step further. It answers “What should we do now?” It combines everything from descriptive, diagnostic, and predictive analysis to suggest the best action. A lot of data-driven companies rely on this because just knowing what happened or what might happen isn’t enough—they want clear guidance on what action to take.
Process of Data Analysis
Doing data analysis isn’t just one step—it’s more of a flow. Usually, it happens in these stages:
- Data Requirement Gathering - First, you ask yourself: why am I doing this analysis? What’s the problem I’m solving? What kind of data do I need? This step sets the direction for everything else.
- Data Collection - Once you know what you need, you start collecting it from different sources. It’s always good to note where and when you collected it, because that matters later.
- Data Cleaning - Raw data is messy. It can have duplicates, missing values, or errors. Cleaning it makes sure you’re only working with relevant and accurate data. Without this step, your final results can be way off.
- Data Analysis - After cleaning, you actually dig in. You might use software or tools here to find insights. Sometimes, while analyzing, you realize you need more data, and that’s normal.
- Data Interpretation - Once you’ve got the results, you explain them. This could be in simple words, tables, or charts. The goal is to make sense of the numbers and decide what they mean for you or your business.
- Data Visualization - Finally, you show the data in a visual form—like charts, graphs, or dashboards. Visuals make it easier to spot patterns and compare different things quickly. They’re also easier for others to understand.
Wrapping It Up
At the end of the day, data analysis is just about turning raw data into knowledge you can use. It doesn’t matter if it’s a business strategy or a personal decision—the process is the same: look at past info, understand what’s happening now, and try to predict or decide what’s best for the future.


